Spectra
This case consists of the definition of series of SPECTRA that describe the support movement loading
for primary and secondary floor response cases.
When selecting Spectra, all existing spectra are listed in the combobox :
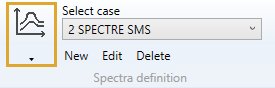
The spectra appear with their Event number + Title.
When editing, the definition window shows up :
1. General
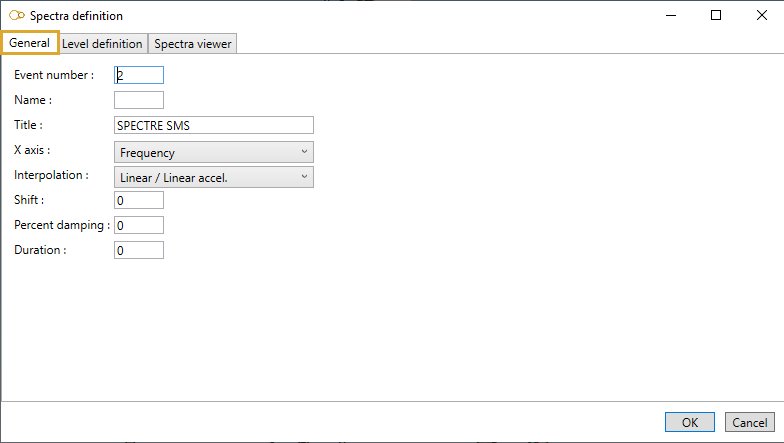
Enter an Event number, a Name and a Title.
The primary and secondary floor response cases with the same EVENT will use the spectra defined herein.
X axis :
- Spectrum is frequency vs. acceleration
- Spectrum is period vs. acceleration
Interpolation :
- Linear / Linear acceleration
- Linear frequency / Linear acceleration
- Linear period / Linear acceleration
- Log frequency / Linear acceleration
- Log frequency / Log acceleration
Shift :
The shift (in %) determines an interval about each natural frequency. MetaPiping will use the maximum acceleration in each such interval, as determined by interpolating the spectrum data specified.
This method is used for peak broadening. 0 or blank = no shift.
Percent damping :
The damping is used to determine the intermodal correlation factors for the double sum, Rosenblueth and Der Kiureghian methods.
Duration :
Duration of earthquake (in seconds).
0 or blank = infinite (10^6 s).
2. Level definition
In this tab, you can create/remove LEVELS for the same EVENT :
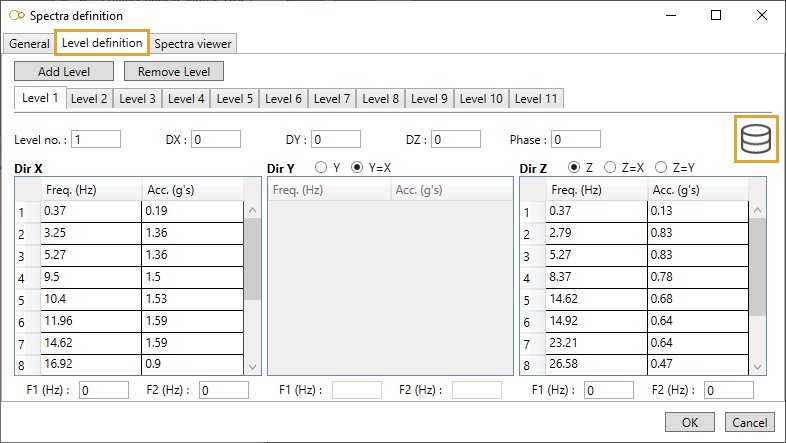
The LEVEL number relates the spectra to the supports.
Click here to have more information about supports.
DX, DY, DZ :
Maximum expected X, Y, Z displacements (mm, in).
Phase :
The response for levels with the same phase number > 0 are assumed to be in phase and will be added algebraically.
Spectrum in direction X, Y, Z :
Enter acceleration for each frequency/period.
Attention, the frequency/period must be entered in ascending order.
The possible cases are :
- X + Y + Z = a spectrum for each direction
- X + YZ = a spectrum for X and a common one for Y and Z
- Y + XZ = a spectrum for Y and a common one for X and Z
- Z + XY = a spectrum for Z and a common one for X and Y
- XYZ = the same spectrum for all directions
F1 and F2 :
Low frequency f1 and high frequency f2 for Gupta and Lindley-Yow methods.
Paste from clipboard :
It is possible to copy/paste a whole table from Excel.
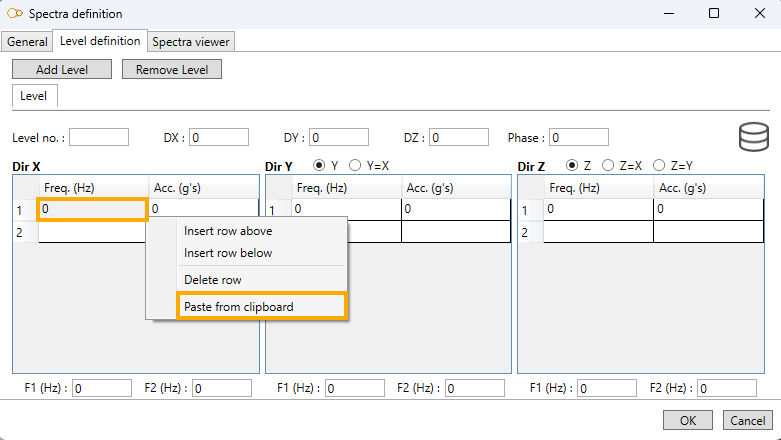
Copy multiple lines with 2 columns in Excel, select the first cell of a level, right click, Paste from clipboard.
2.1 Database
The Database button on upper right corner gives an access to the spectra libraries :
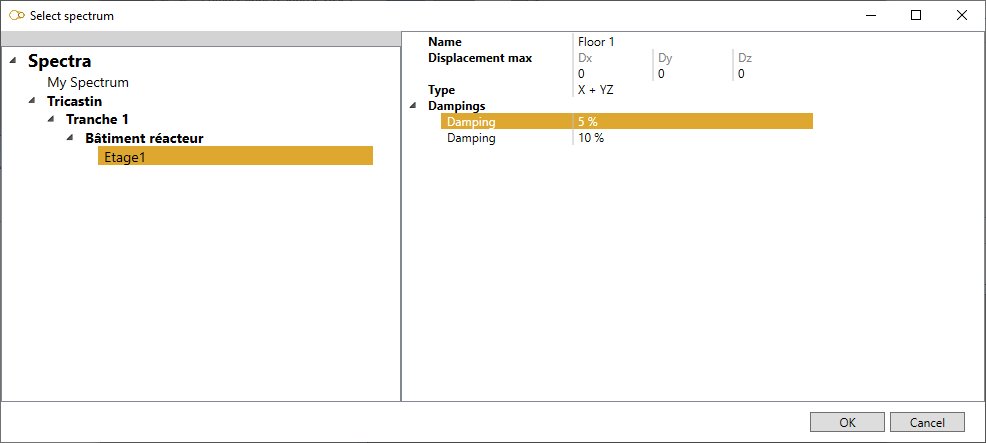
Select a library on the left treeview, then select a row that represents a particular damping for a predefined spectrum. Some values are just informative. Click OK. The properties are copied to the spectrum screen.
Click here to have more information about spectrum database.
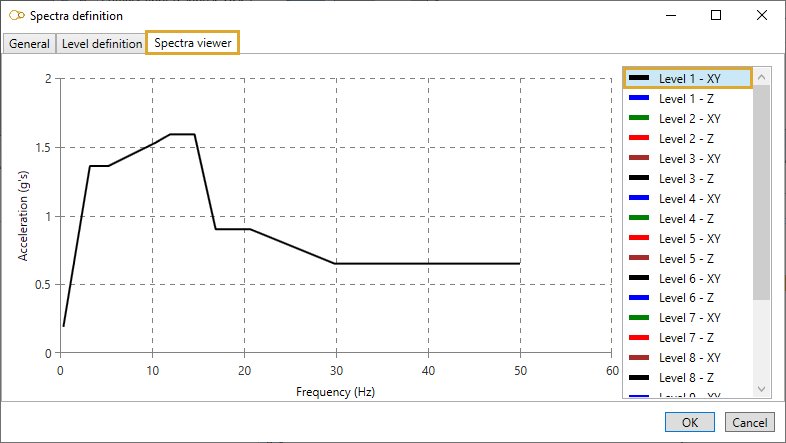
3. Spectra viewer
Select a level on the right list to see the spectrum graph :
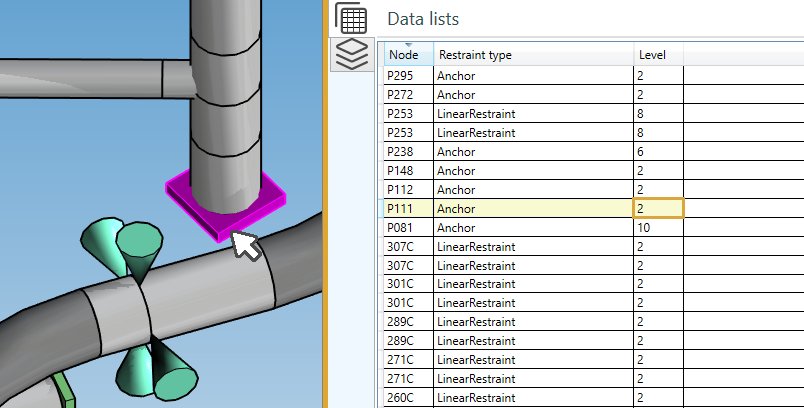
4. Restraints
You can now select restraints or create one on a selected node and affect the Level property (set the level number) :
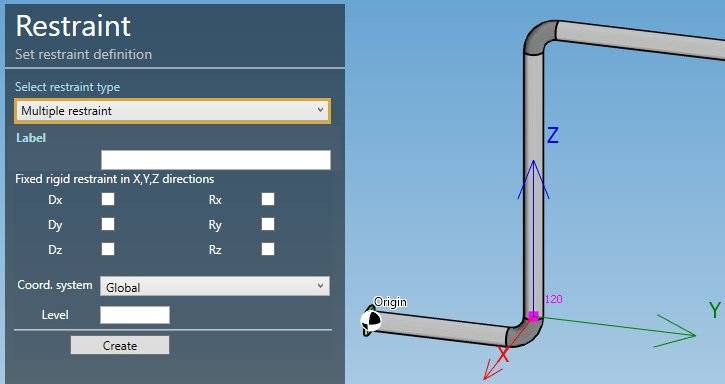
You can also check the property on Review mode (type Restraints):