Piping analysis
1. Data panel
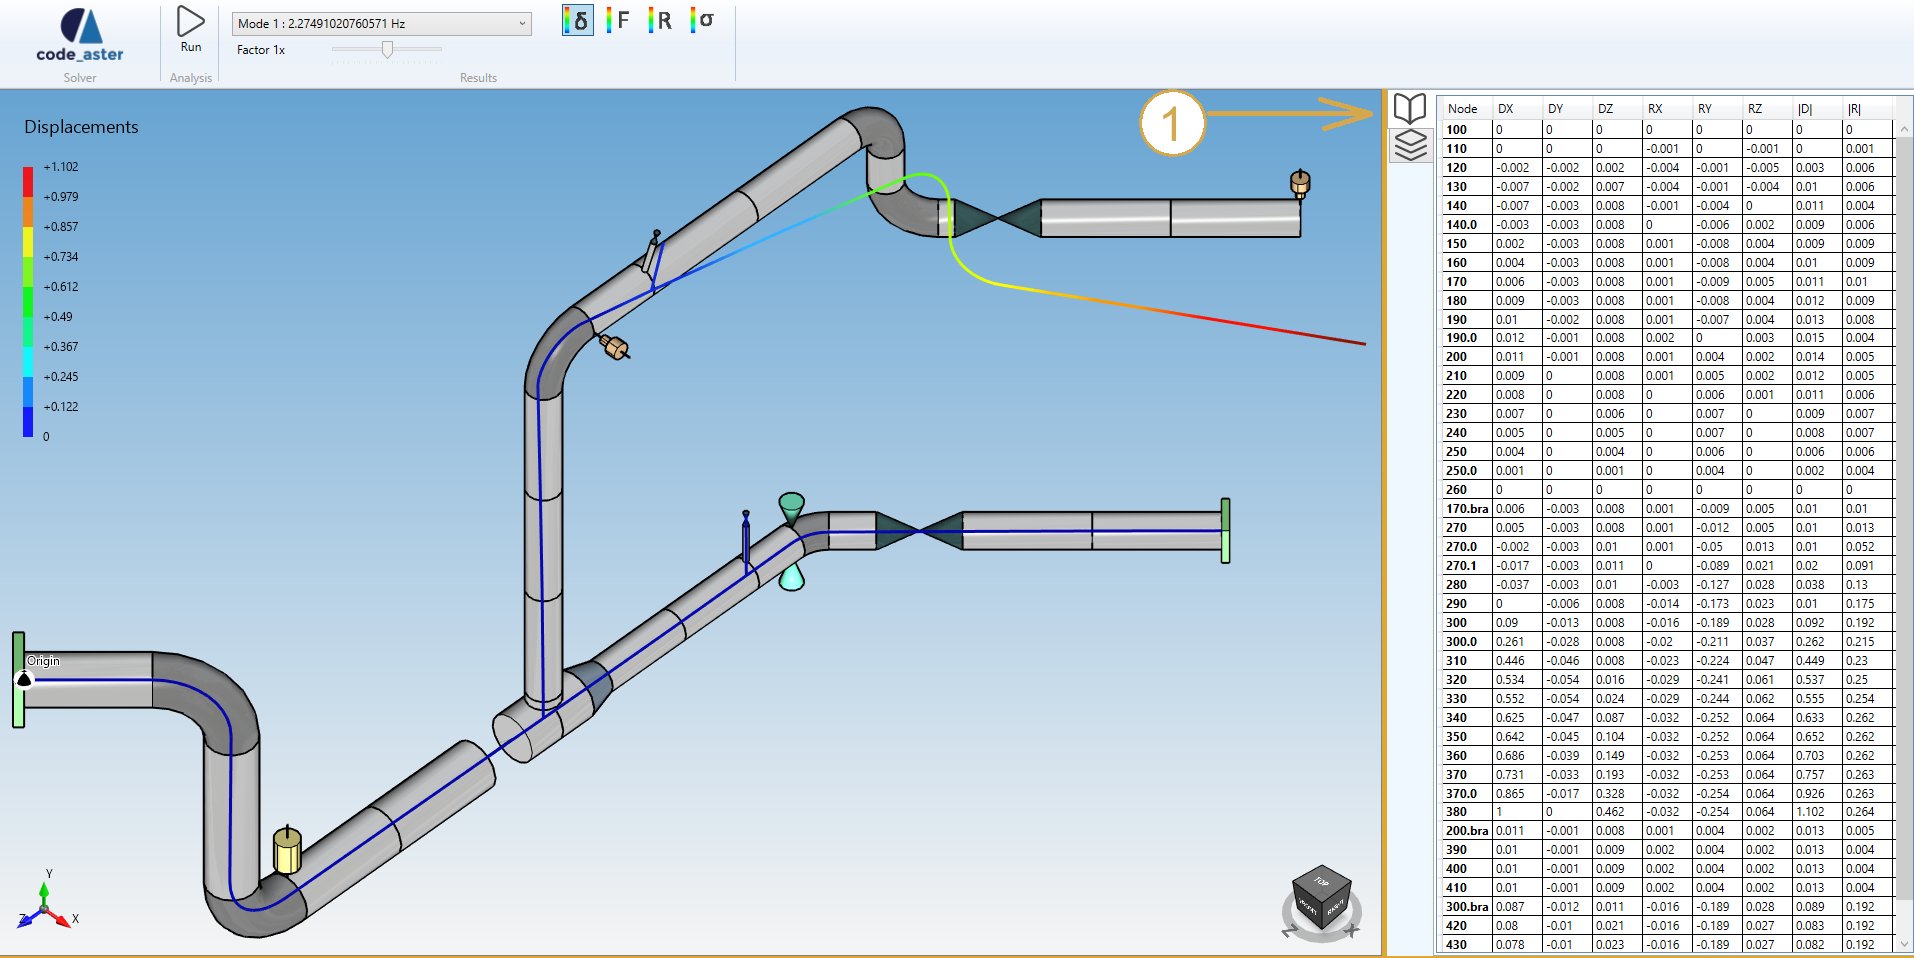
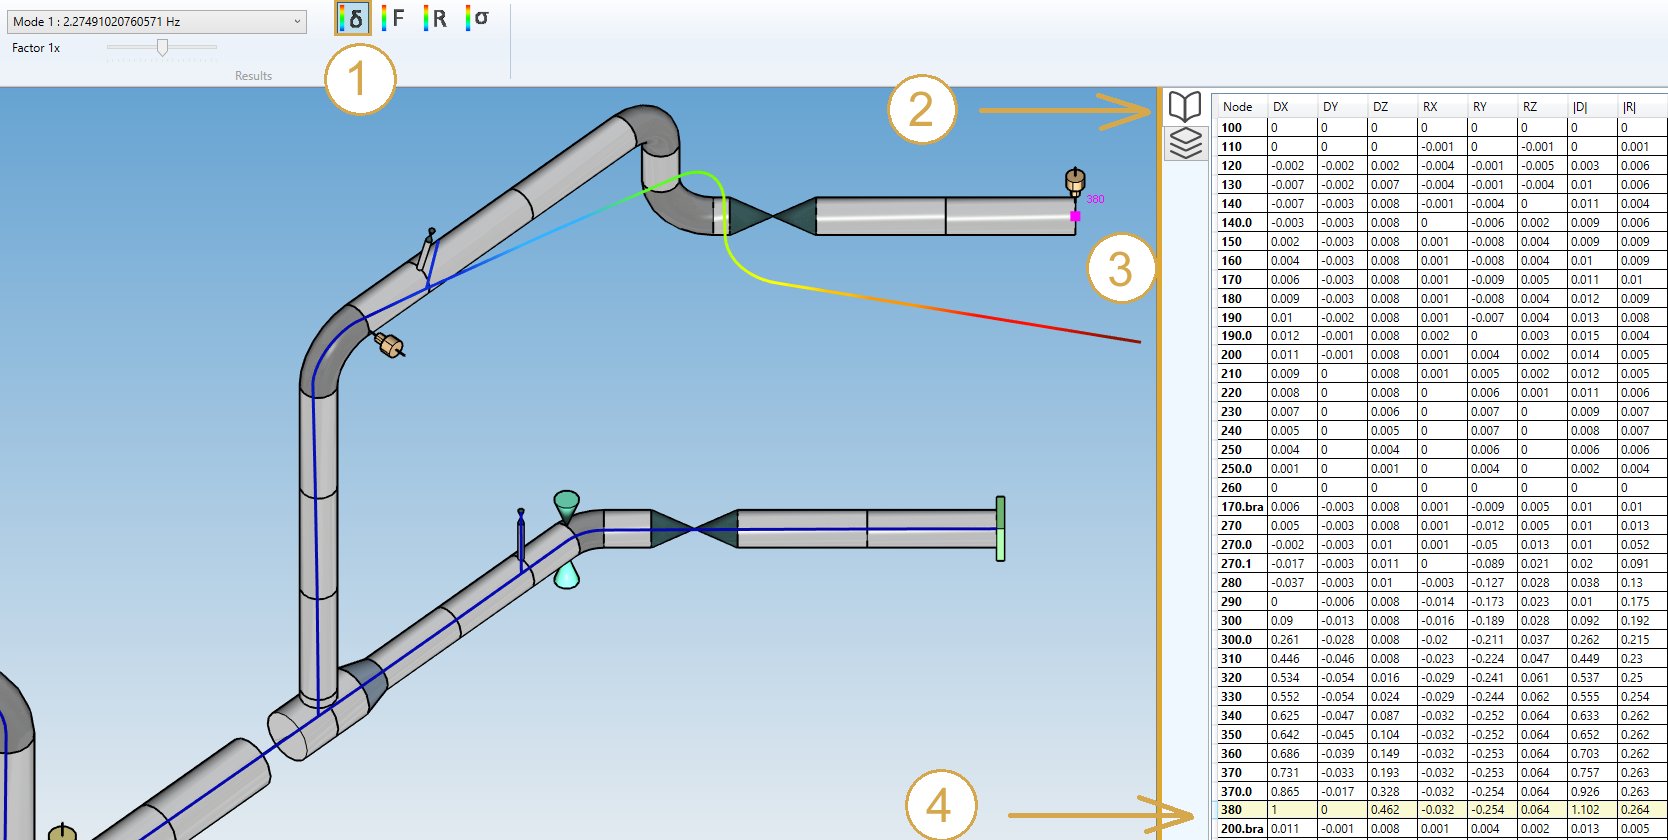
After analysis, a right panel can be opened by clicking on the top button (1). It presents the selected results :
Shortcut to open the data panel = F2.
2. Results
Click on the RUN button :

After a few seconds, the results of the analysis are shown. This panel will appear :
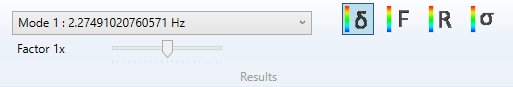
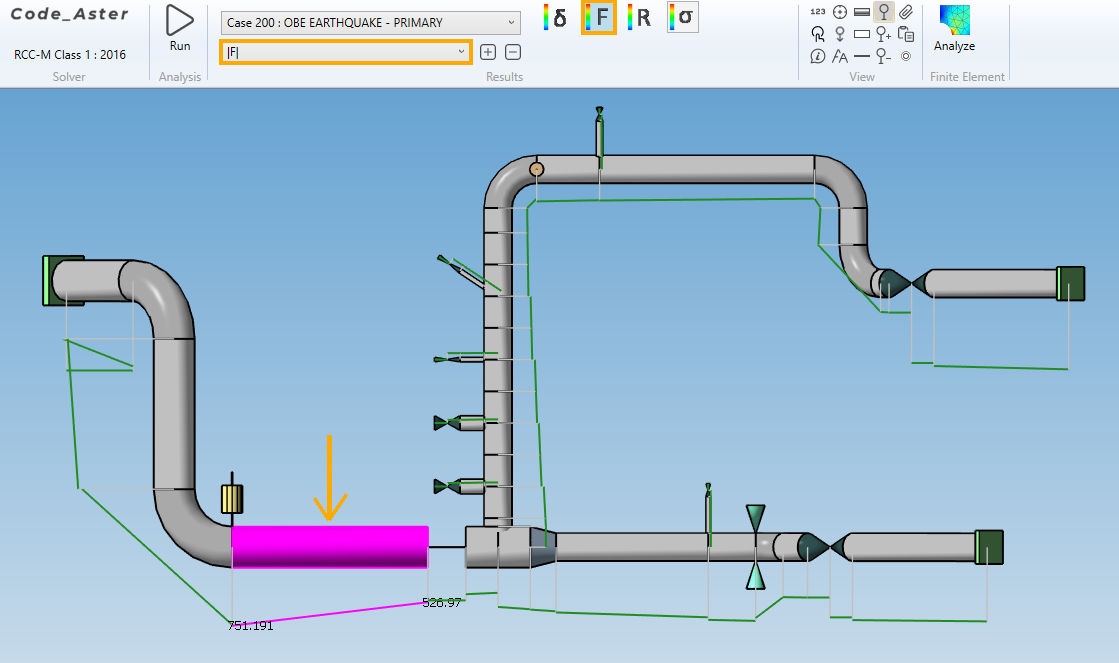
Select a case and the type of results :
- Displacements
- Forces and moments
- Reactions
- Stresses
2.1 Load cases
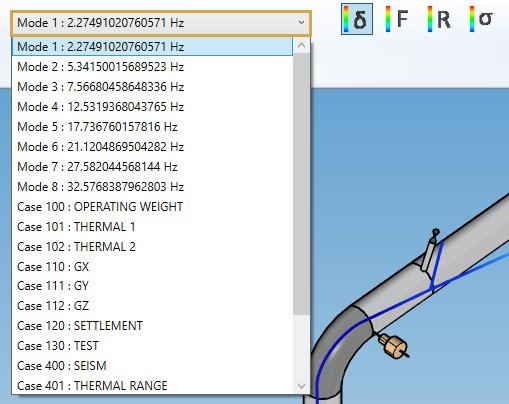
The combobox shows all calculated load cases :
The loadings can be defined here.
The Modes are generated if the Extract modes is checked in the Model options screen :
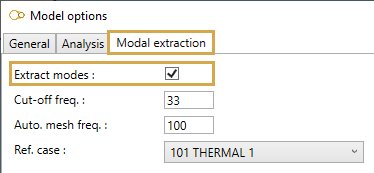
Click here to have more information about the model options.
A special load case “Fatigue” is added at the bottom of the combobox for Class 1 piping codes (Code Aster solver only). It allows to visualize the results of the detailed fatigue analysis and also, for the RCC-MRx code, the progressive deformation and fatigue + creep interaction check.
A special load case “Creep” is added at the bottom of the combobox for RCC-MRx code if creep is not negligible (Code Aster solver only). It allows to visualize the results of the creep analysis : UA,C(pm), UA,C(pm + Φ⋅pb), ΔUA, WA,C,D(1.35pm) and WA,C,D(1.35(pm + Φ⋅pb)).
2.2 Displacements
- Select the Displacement button
- Open the right Data panel
- Select a node
- The results are highlighted
Shortcut to open the data panel = F2.
The Data panel shows the global displacements for each node.
| Property | Description | Unit Metric | Unit USA |
|---|---|---|---|
| Node name | Text or number | - | - |
| DX | X global displacement | mm | in |
| DY | Y global displacement | mm | in |
| DZ | Z global displacement | mm | in |
| RX | X global rotation | Rad | Rad |
| RY | Y global rotation | Rad | Rad |
| RZ | Z global rotation | Rad | Rad |
| D | Resultant displacement | mm | in |
| R | Resultant rotation | Rad | Rad |
The Selection mode is automatically set to POINT.
You can amplify the displacement by changing the factor cursor.
INTERACTIVITY :
- Click on a Column header to sort the results in ascending or descending order
- Select a row
- The node is highlighted
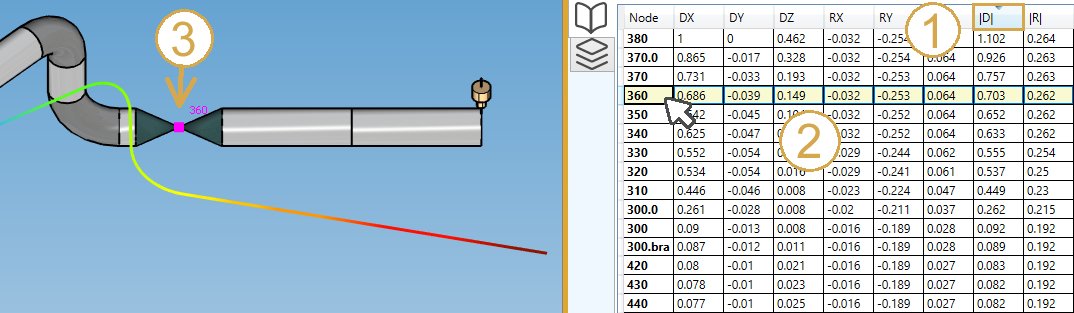
TIP : you can copy the data by CTRL+C and paste in other software.
ANIMATION
The displacements can be animated :
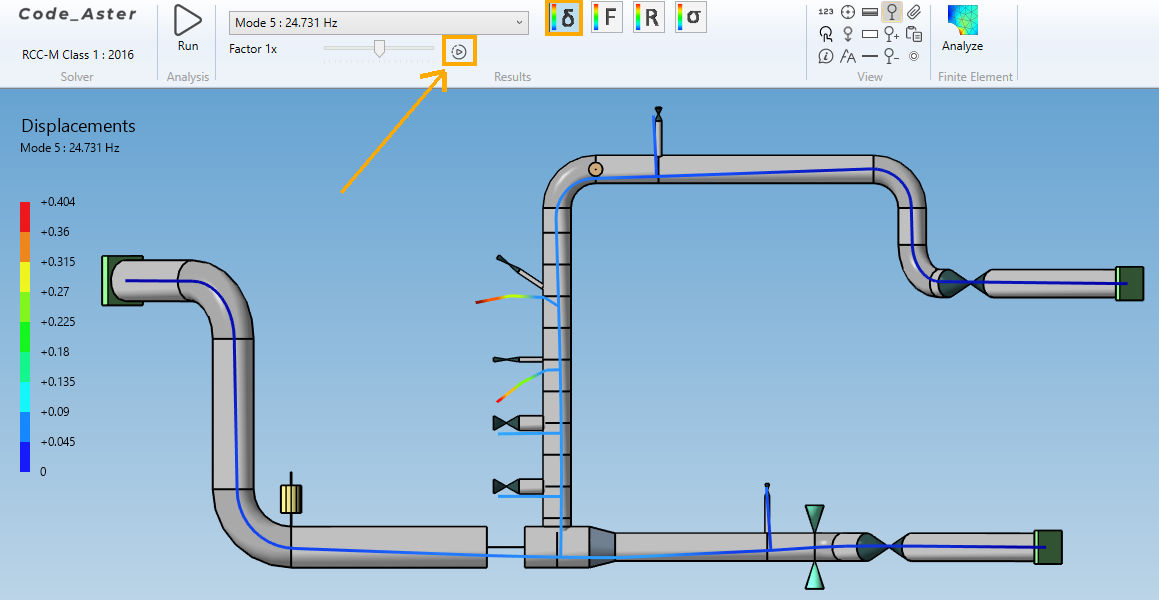
Start/Stop the animation by clicking the play button.
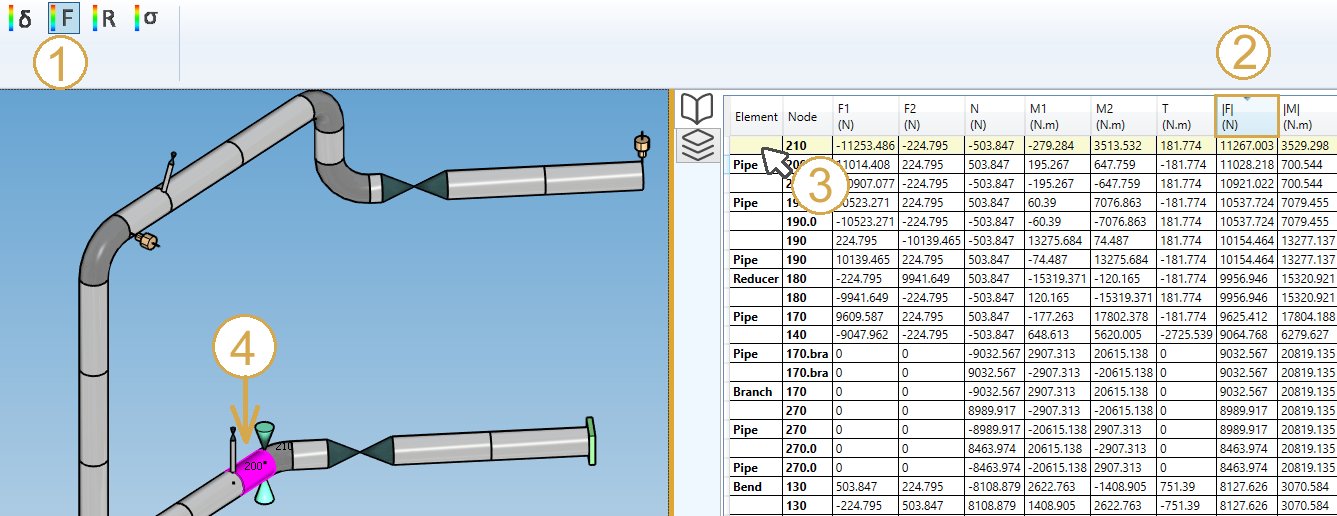
2.3 Forces and moments
- Select the Force button
- Click on a column of the Data panel to sort the data
- Select a row
- The corresponding element is highlighted
Shortcut to open the data panel = F2.
The Data panel shows the forces and moments for the 2 extremities of each element.
| Property | Description | Unit Metric | Unit USA |
|---|---|---|---|
| Element | Type | - | - |
| Node | Node name of the extremity | - | - |
| F1 | Force 1 | N | lb |
| F2 | Force 2 | N | lb |
| N | Normal force | N | lb |
| M1 | Moment 1 | N.m | lb.ft |
| M2 | Moment 2 | N.m | lb.ft |
| T | Torsion | N.m | lb.ft |
| !F! | Resultant force | N | lb |
| !M! | Resultant moment | N.m | lb.ft |
The Selection mode is automatically set to ELEMENT.
DIAGRAMS
Select a diagram of force and moment just below the load case :
Possible diagrams :
- Nothing (default)
- F1 : forces in shear direction 1
- F2 : forces in shear direction 2
- N : normal forces
- M1 : moment in bending direction 1
- M2 : moment in bending direction 2
- T : torsion
- !F! : resultant forces
- !M! : resultant moments
You can increase and decrease the size of the diagram.
Selecting an element shows the extremity values.
The diagram on bends is simplified as a line joining the 2 values!
2.4 Reactions
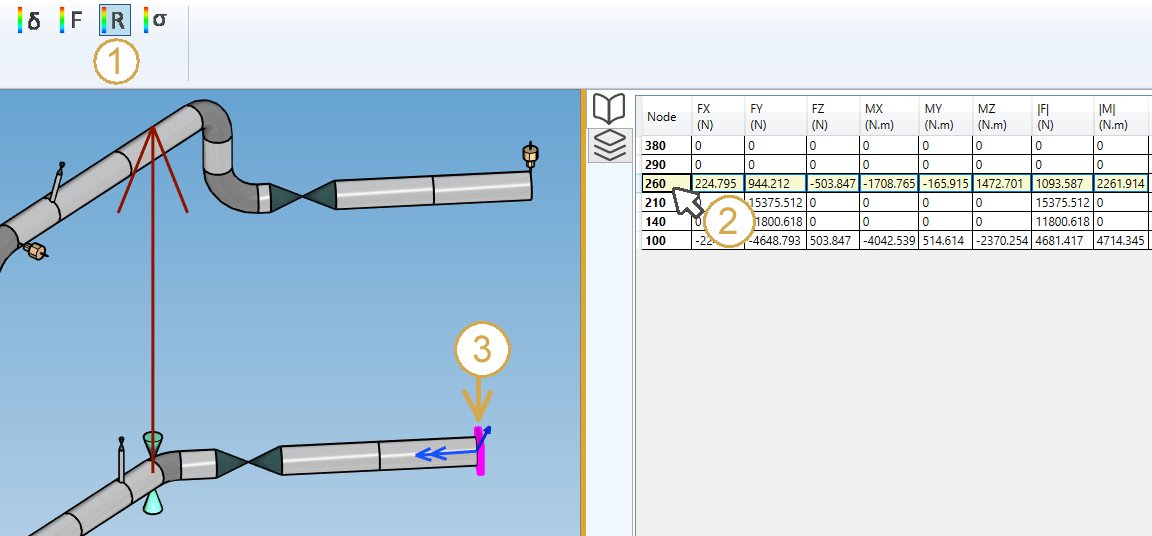
- Select the Reaction button
- Select a row on the data panel
- The corresponding restraint is highlighted
Or select directly a restraint to highlight the corresponding row.
Shortcut to open the data panel = F2.
The Data panel shows the forces and moments (reactions) for each node.
| Property | Description | Unit Metric | Unit USA |
|---|---|---|---|
| Node | Node name | - | - |
| FX | X component of the reaction force | N | lb |
| FY | Y component of the reaction force | N | lb |
| FZ | Z component of the reaction force | N | lb |
| MX | X component of the reaction moment | N.m | lb.ft |
| MY | Y component of the reaction moment | N.m | lb.ft |
| MZ | Z component of the reaction moment | N.m | lb.ft |
| !F! | Resultant reaction force | N | lb |
| !M! | Resultant reaction moment | N.m | lb.ft |
The forces are represented by a simple arrow.
The moments are represented by a double arrow.
The Selection mode is automatically set to RESTRAINT.
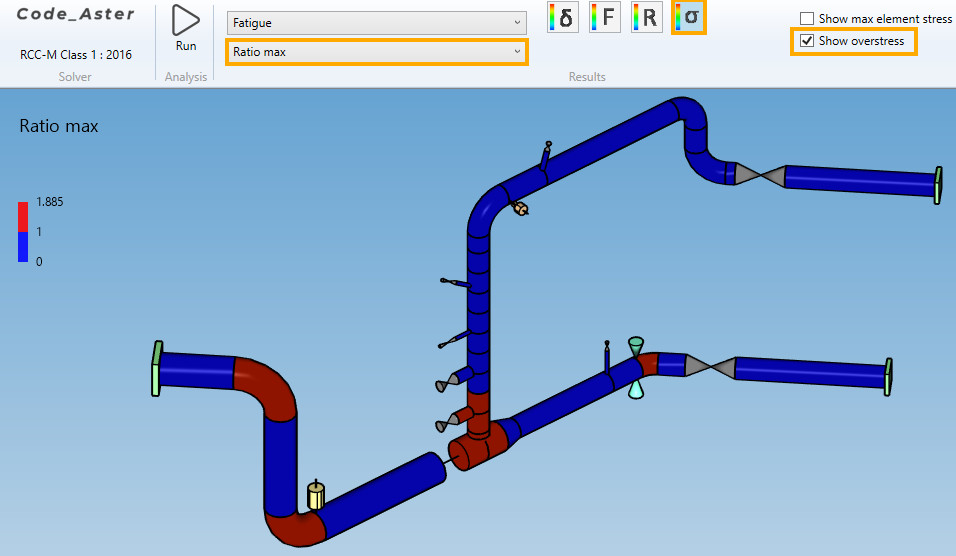
2.5 Stresses
- Select the Stress button
- Select the result type
- Click on a column of the Data panel to sort the desired data
- Select a row
- The corresponding element is highlighted
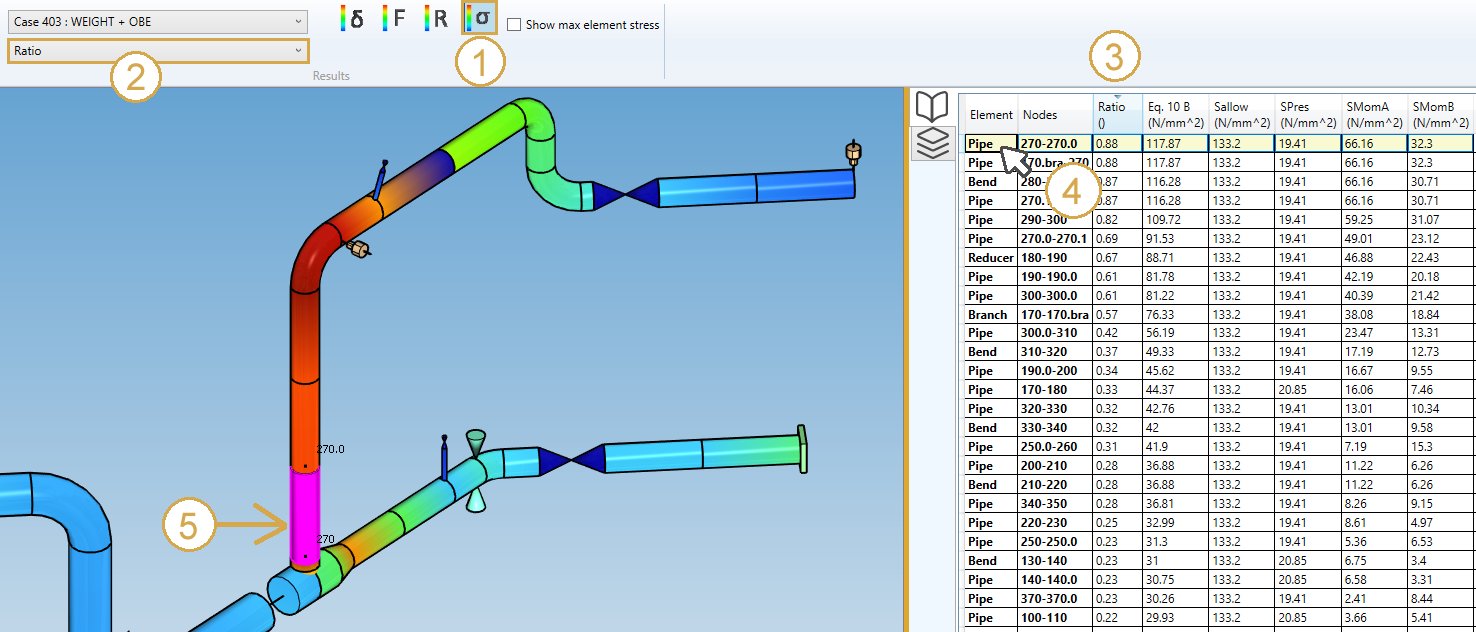
The results are code dependent. The third column shows the stress ratio, defined as the calculated stress divided by the allowable stress.
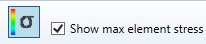
The stresses are shown at each extremity of the elements. The maximum stresses of both extremities may be displayed instead by checking “Show max element stress” :
The Selection mode is automatically set to ELEMENT.
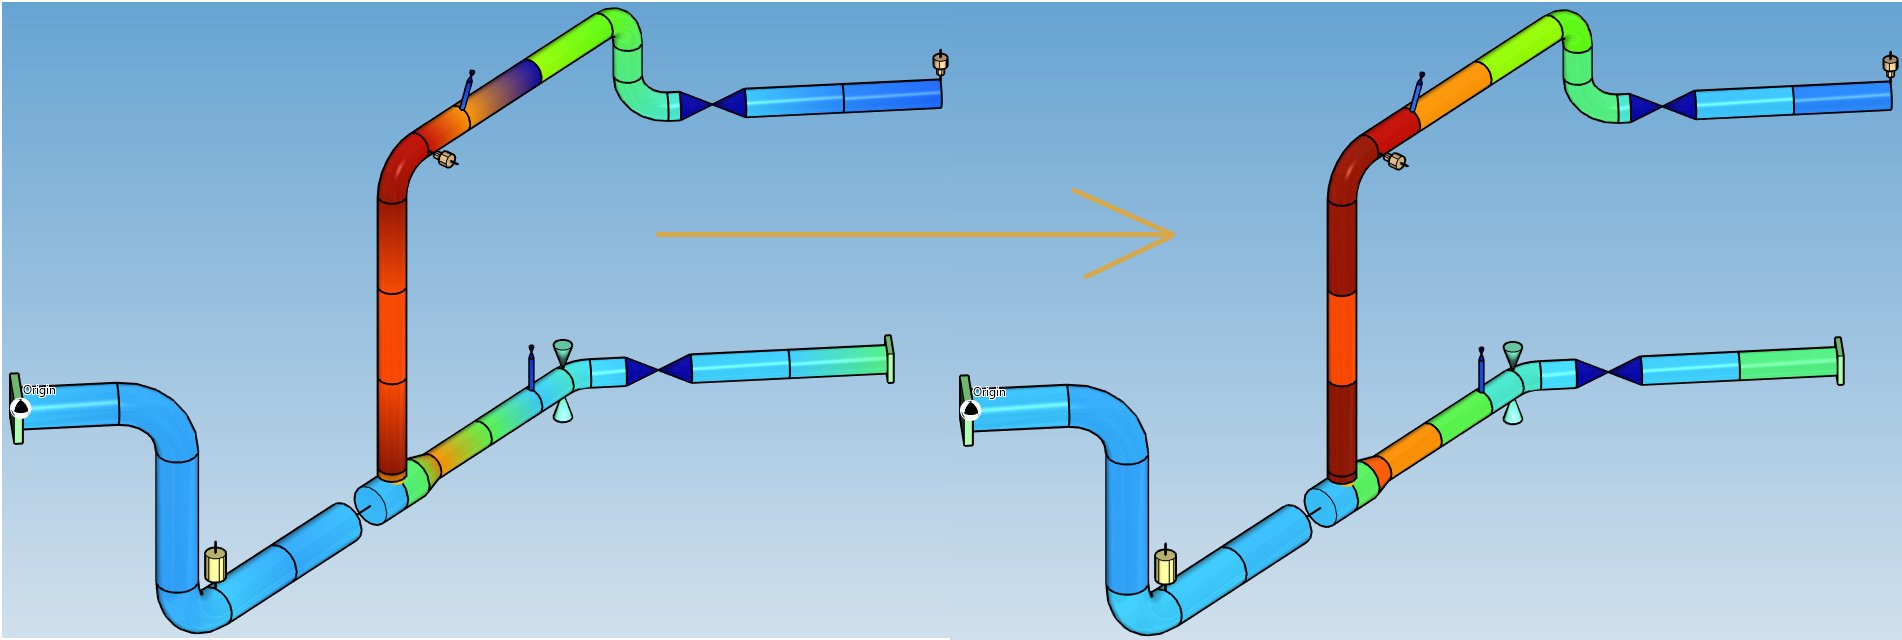
Overstress
For result type = Ratio or Ratio max, check the overstress box to see the two color map with all element with ratio > 1 in red :
3. Result files
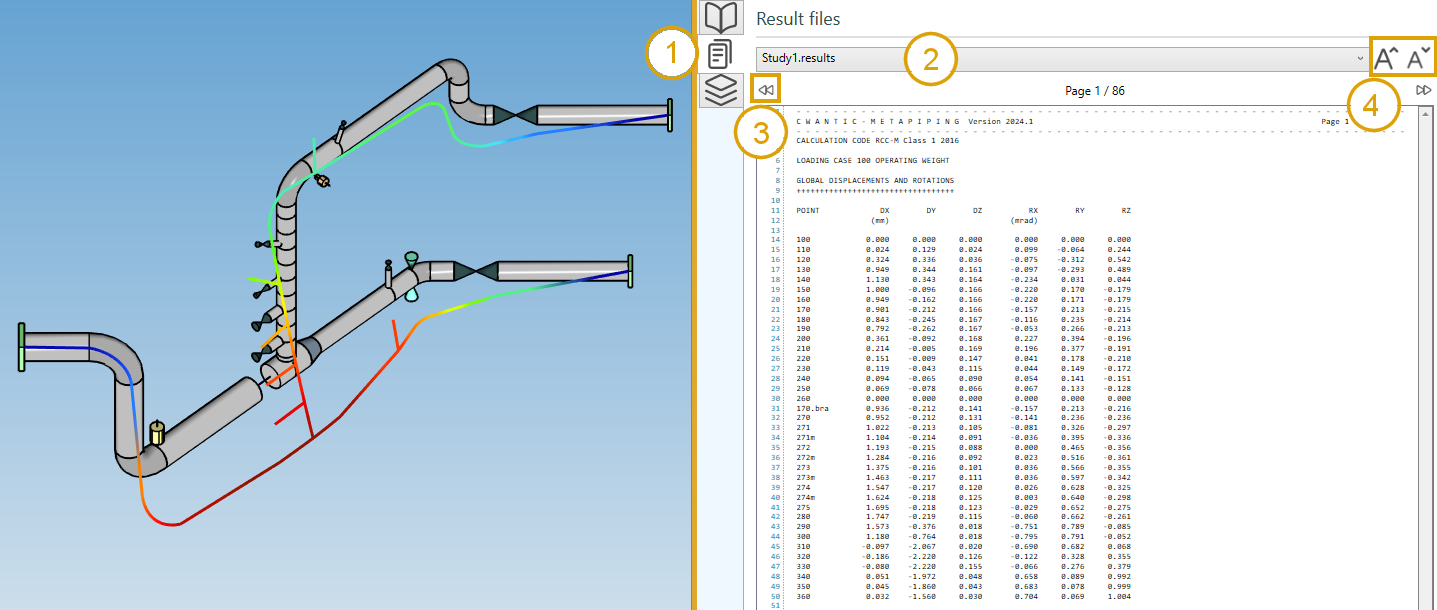
- Click on the File button on the right controller :
- Select a file in the list
- Navigate through the pages of the document with the left and right button (or PgDn and PgUp shortcuts)
- Increase or decrease the size of the font
Tip: you can copy the content of the file
Tip: If the analysis failed, a warning file will be available to know what happened.