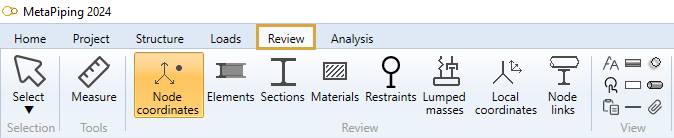
Structure review
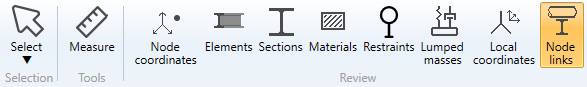
1. Ribbon menu
2. Data panel
A right panel can be opened by clicking on the top button. It presents the selected data :
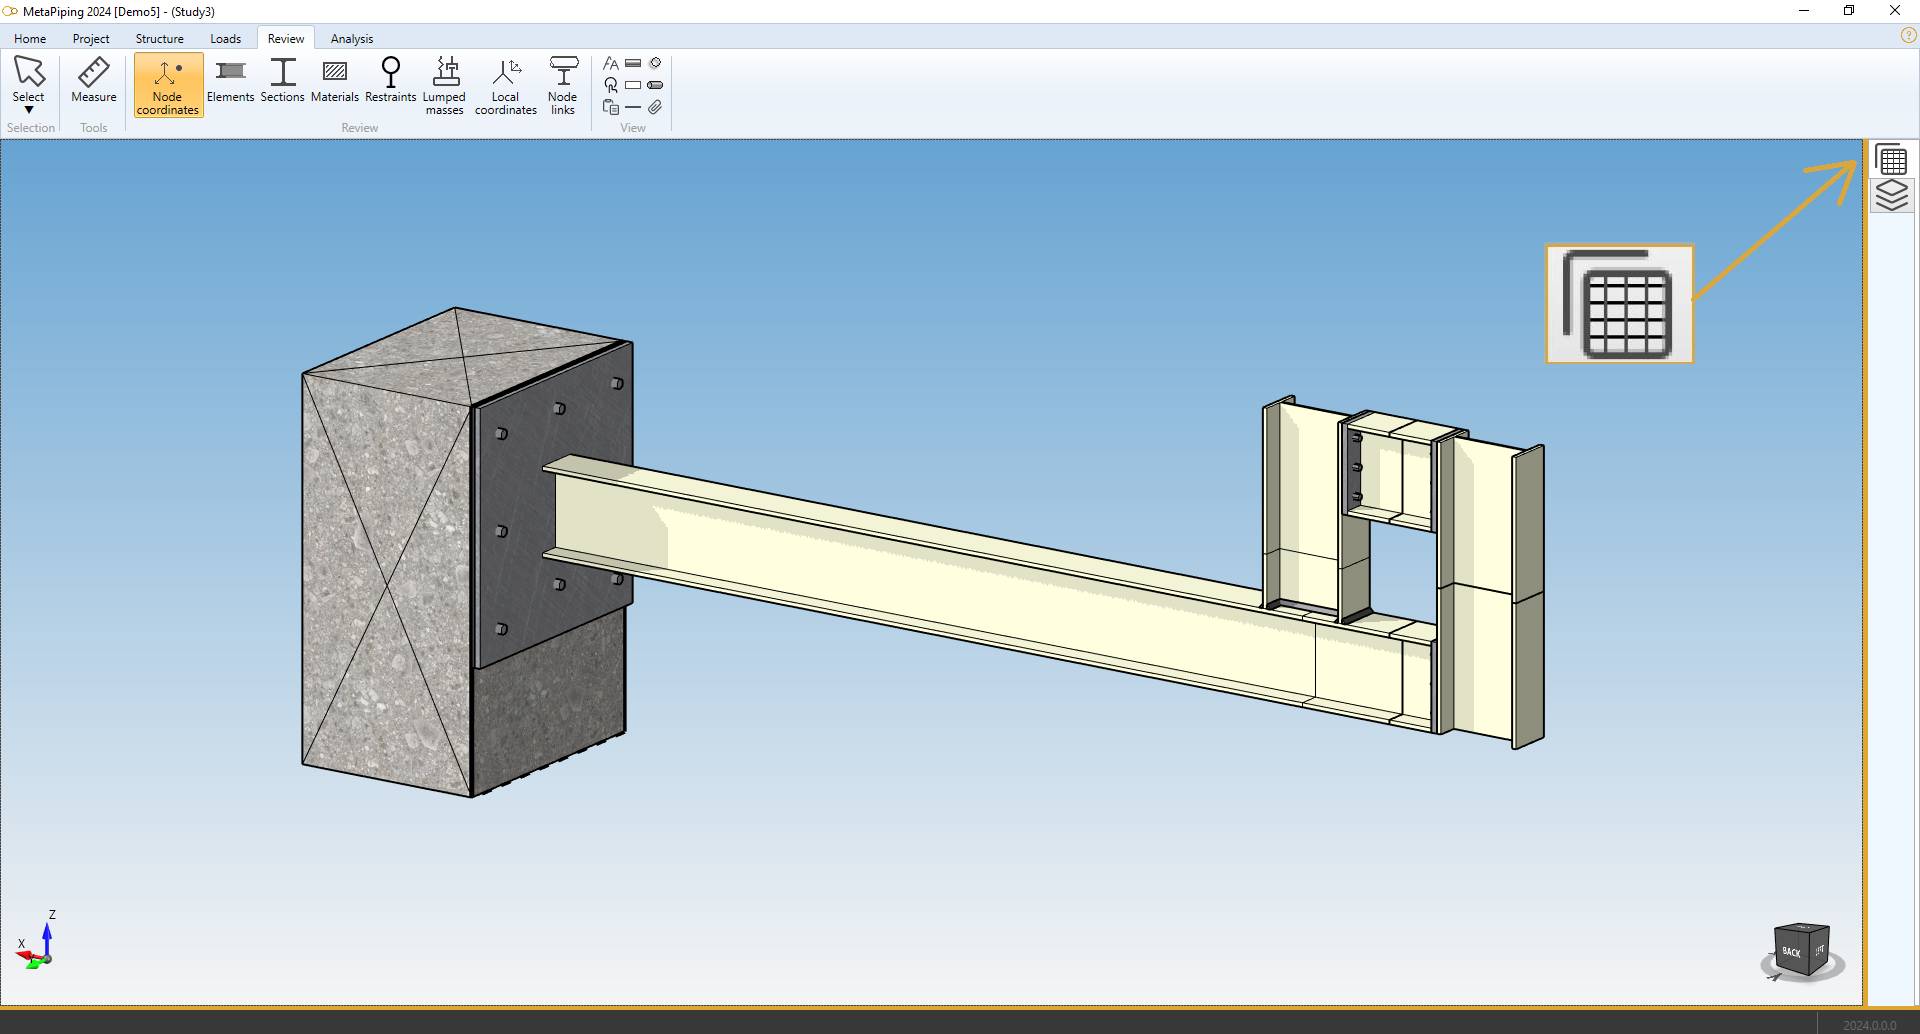
Click on the same button to hide the panel. Shortcut = F2.
TIP : you can copy the data by CTRL+C and paste on other software.
3. Measure tool
MetaStructure lets you measure the distance between 2 nodes :
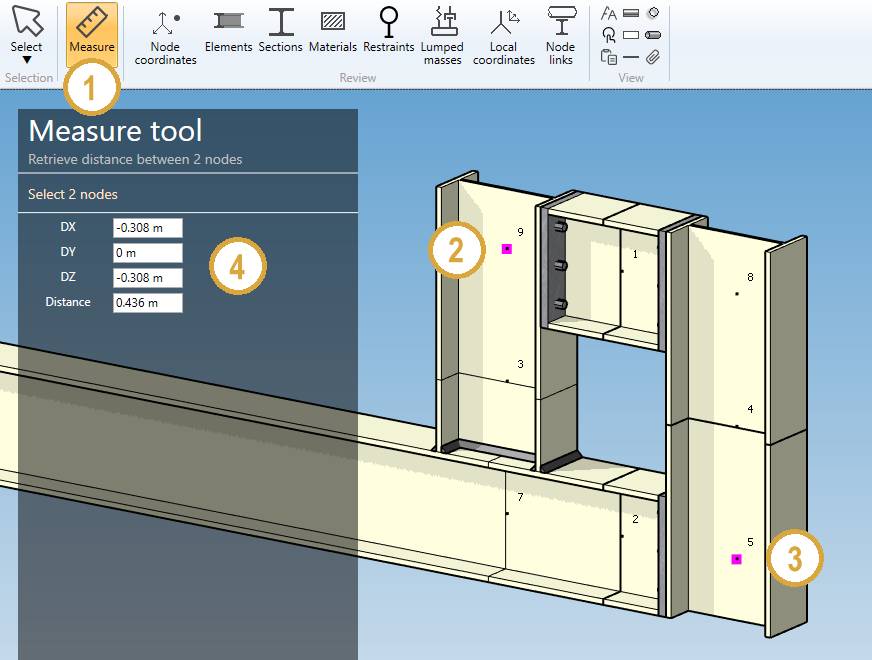
- Select the Measure tool
- Select the first node
- Select the second node with CTRL pressed
- The distances appear on the left panel
You can continue to select other nodes (with CTRL pressed), only the 2 last ones will be taken in account.
| Property | Description | Unit Metric | Unit USA |
|---|---|---|---|
| DX | Distance on global X | m | ft |
| DY | Distance on global Y | m | ft |
| DZ | Distance on global Z | m | ft |
| Distance | Distance between the 2 nodes | m | ft |
The Selection mode is automatically set to POINT when clicking the Measure button.
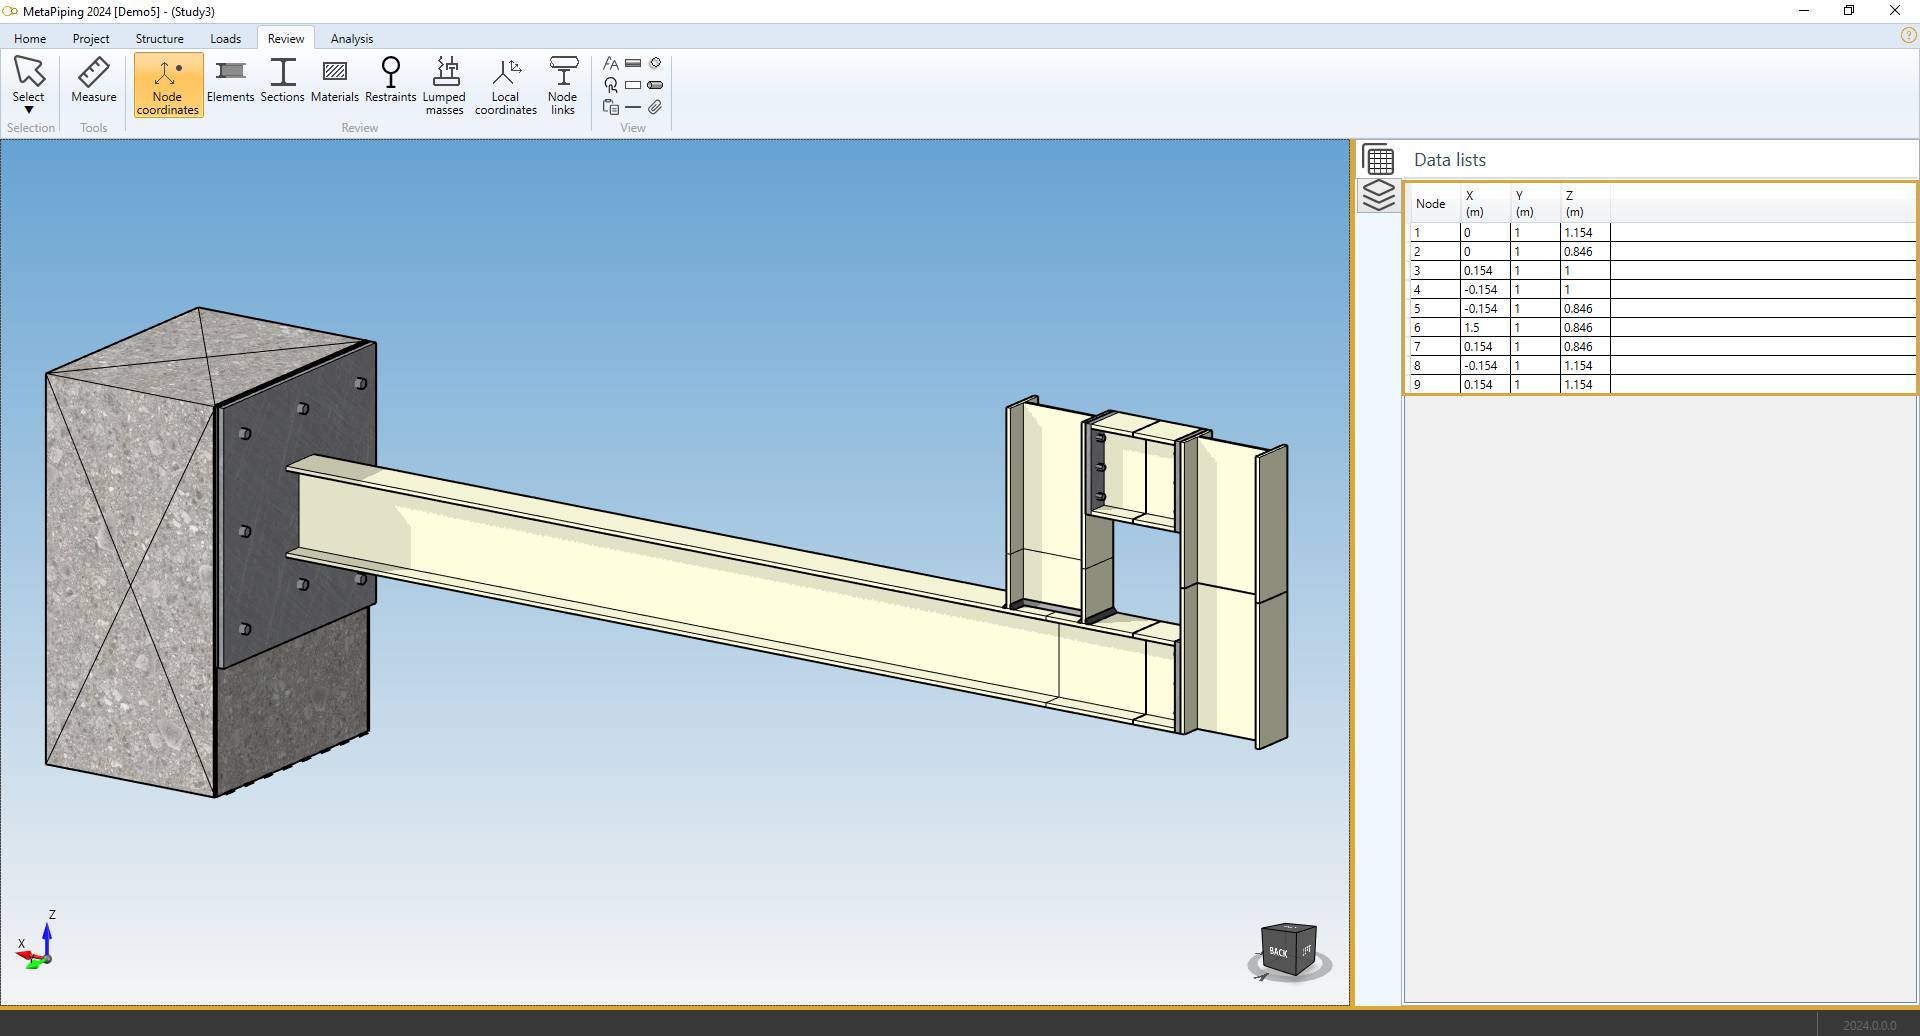
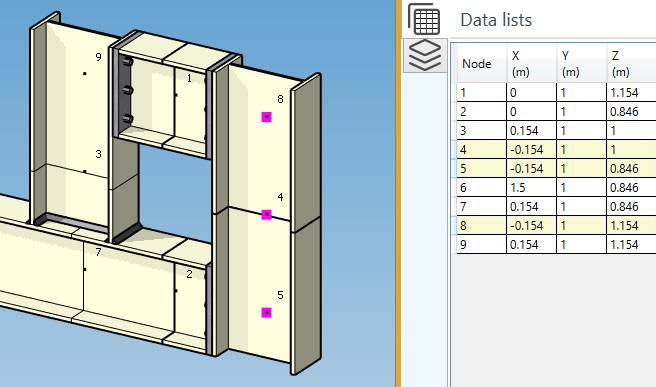
4. Node coordinates
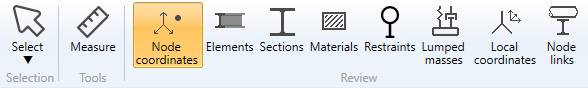
Click on the Node coordinates button :
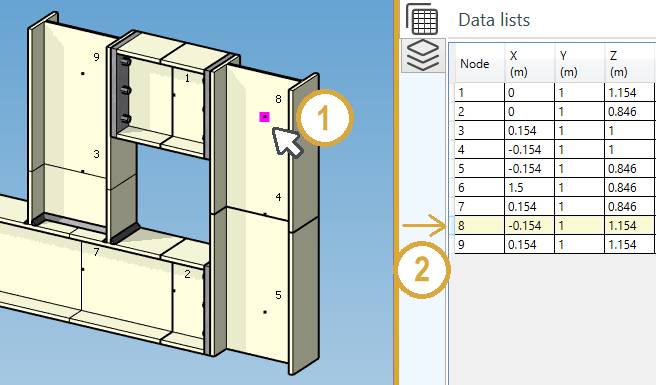
The Data panel shows the global coordinates X, Y, Z for each node.
| Property | Description | Unit Metric | Unit USA |
|---|---|---|---|
| Node name | Text or number | - | - |
| X | X global coordinate | m | ft |
| Y | Y global coordinate | m | ft |
| Z | Z global coordinate | m | ft |
The Selection mode is automatically set to POINT
INTERACTIVITY :
- Select a node on the model (1) will highlight the corresponding row on the data list (2) :
- Select a row on the data list (1) will highlight the corresponding node on the model (2) :
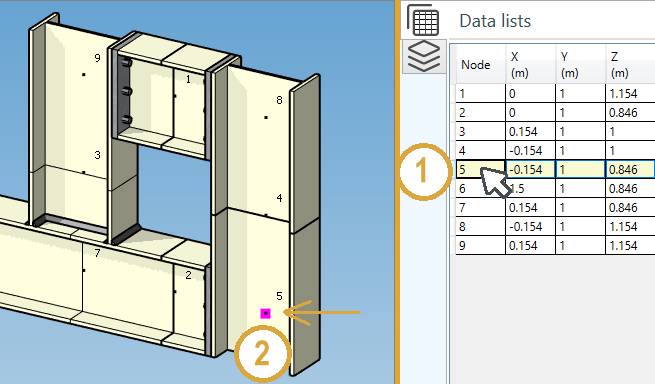
The data are not editable
- Hold down the left mouse button to make a rectangular selection :
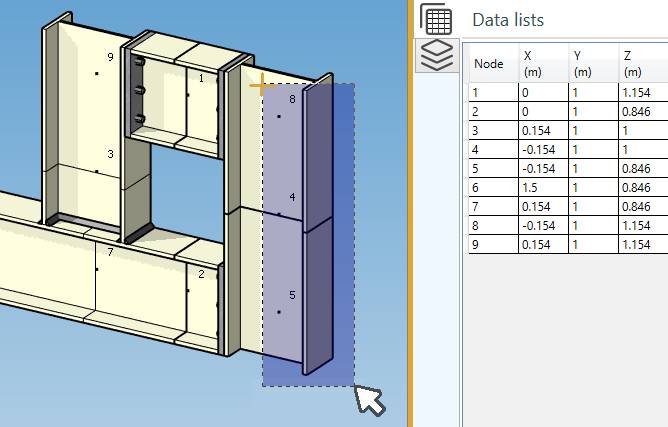
Release the mouse button, the data are highlighted :
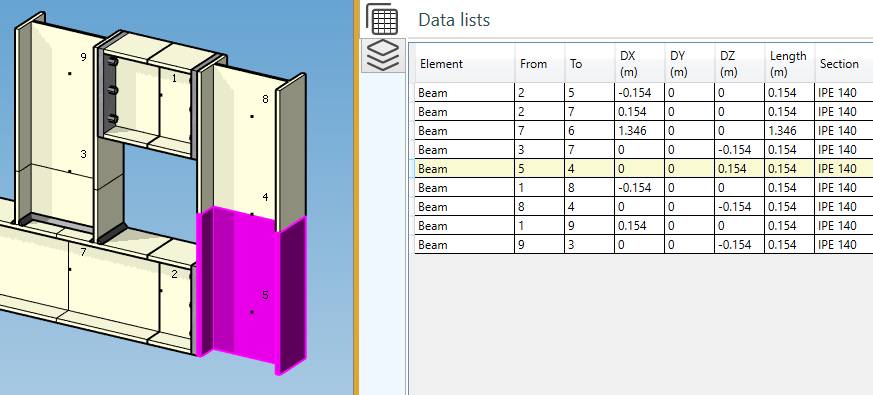
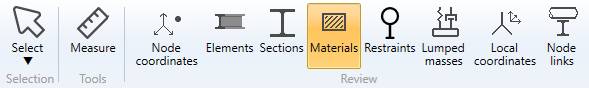
5. Elements
Click on the Elements button :
| Property | Unit Metric | Unit USA |
|---|---|---|
| Element type | - | - |
| Node1 name | - | - |
| Node2 name | - | - |
| DX | m | ft |
| DY | m | ft |
| DZ | m | ft |
| Length | m | ft |
| Section | - | - |
The INTERACTIVITY is the same as explained on §5.
The data are not editable
6. Sections
Click on the Sections button :
The beam elements are colorized in the color of their corresponding section.
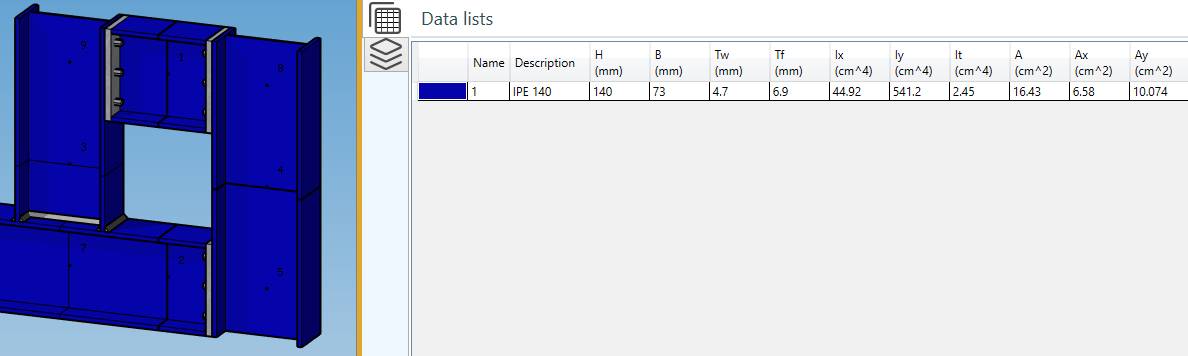
| Property | Description | Unit Metric | Unit USA |
|---|---|---|---|
| Section color | - | - | - |
| Name | Section’s name | - | - |
| Description | Section’s description | - | - |
| h | Height | mm | in |
| b | Basis | mm | in |
| tw | Web thickness | mm | in |
| tf | Flange thickness | mm | in |
| Ix | Bending inertia X | cm^4 | in^4 |
| Iy | Bending inertia Y | cm^4 | in^4 |
| It | Torsional inertia | cm^4 | in^4 |
| A | Area | cm² | in² |
| Ax | Shear area X | cm² | in² |
| Ay | Shear area Y | cm² | in² |
The data are not editable
Other properties can be found on the Data screen. Click here for more information.
7. Materials
Click on the Materials button :
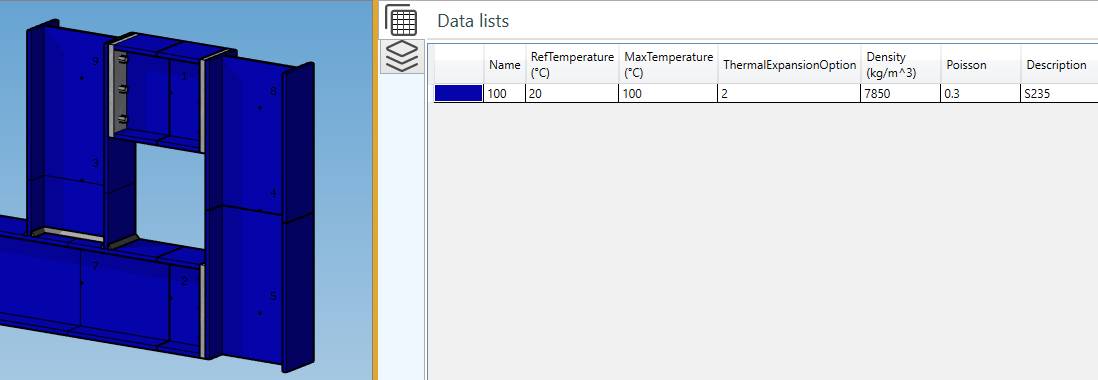
The elements are colorized in the color of their corresponding material.
| Property | Unit Metric | Unit USA |
|---|---|---|
| Material color | - | - |
| Name | - | - |
| Ref temperature | °C | °F |
| Max temperature | °C | °F |
| Thermal expansion option | - | - |
| Density | kg/m³ | lb/ft³ |
| Poisson | - | - |
| Description | - | - |
The data are not editable
8. Restraints
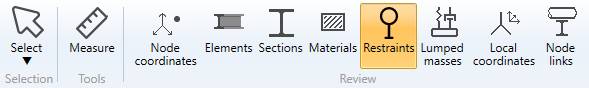
Click on the Restraints button :
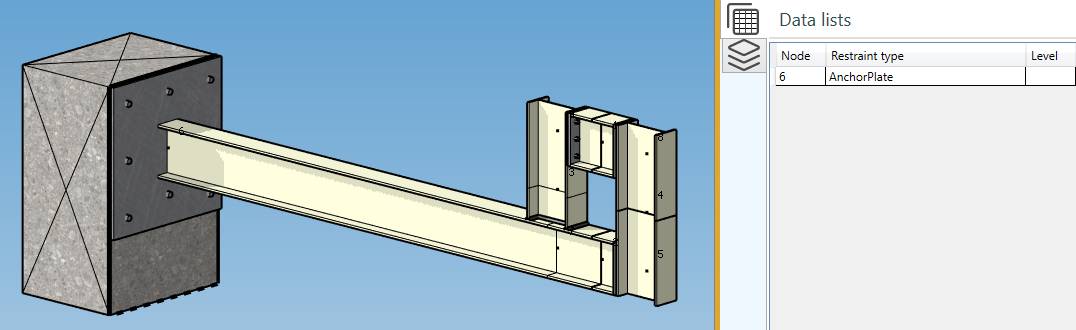
The Data panel shows the Restraint type and the Level for each restraint.
The INTERACTIVITY is the same as explained on §5.
The data are not editable
Click here for more informations about Level during Spectra definition.
9. Lumped masses
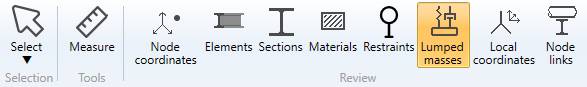
Click on the Lumped masses button :
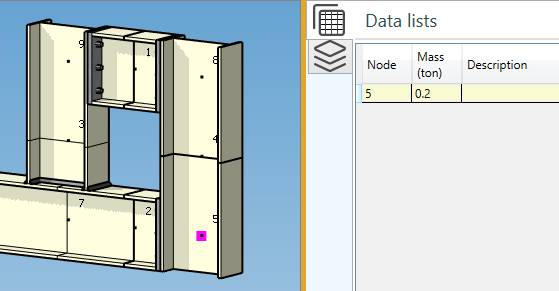
| Property | Unit Metric | Unit USA |
|---|---|---|
| Node name | - | - |
| Mass | ton | kips |
| Description | - | - |
Click here for more information about creation of lumped mass on node.
The INTERACTIVITY is the same as explained on §5.
The data are not editable
10. Local coordinates
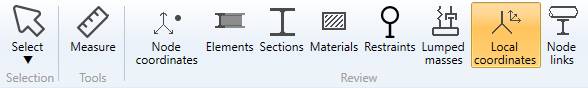
It is useful to define a new coordinate system especially if we need to orient an Anchor plate on a node.
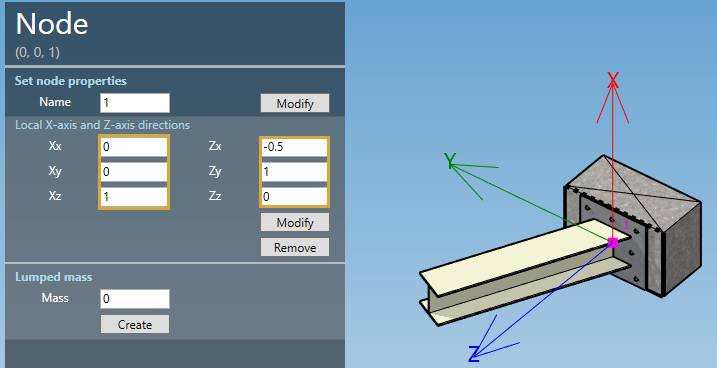
Click on the Local coordinates button :
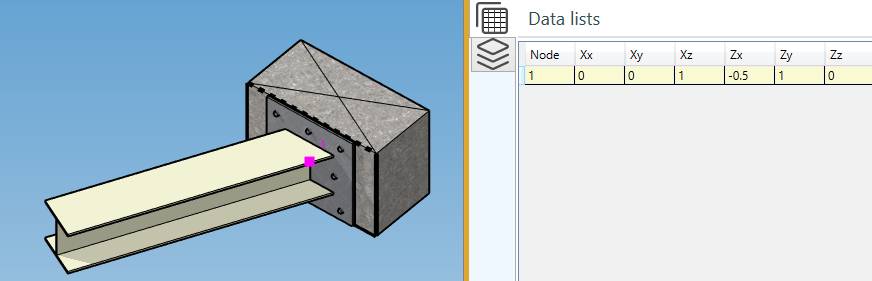
| Property | Unit Metric | Unit USA |
|---|---|---|
| Node name | - | - |
| Xx | - | - |
| Xy | - | - |
| Xz | - | - |
| Zx | - | - |
| Zy | - | - |
| Zz | - | - |
Click here for more information about creation a new coordinate system on node.
The INTERACTIVITY is the same as explained on §5.
The data are not editable
11. Node links
This tool creates a Link between one piping node and multiple structure nodes.
This link is necessary for load definition (External load) and during analysis.
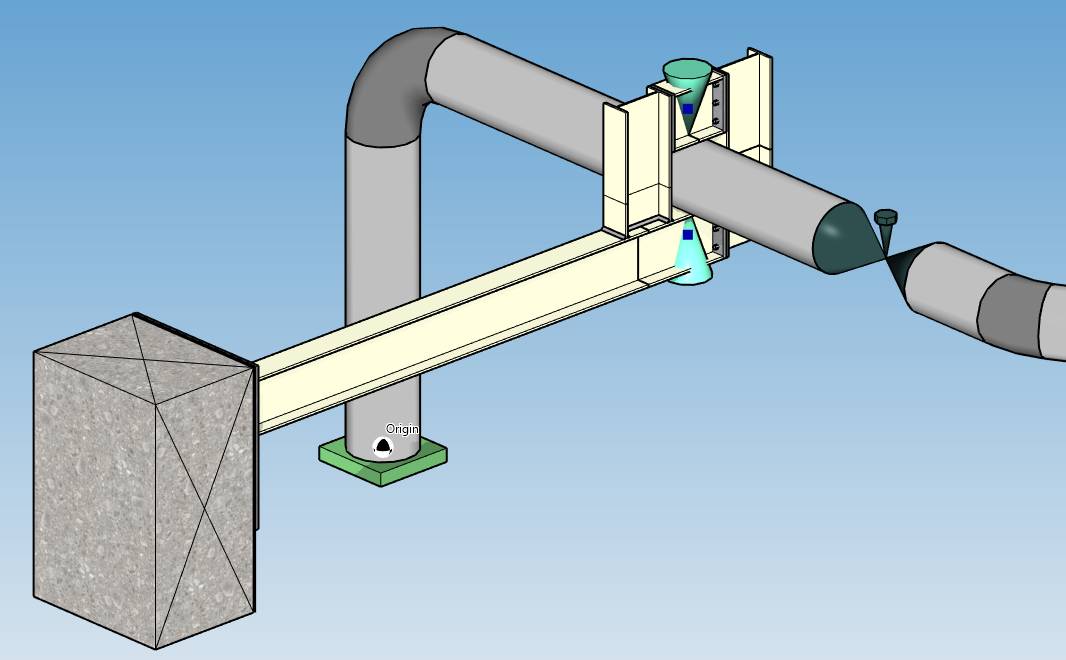
Click on the Node links button :
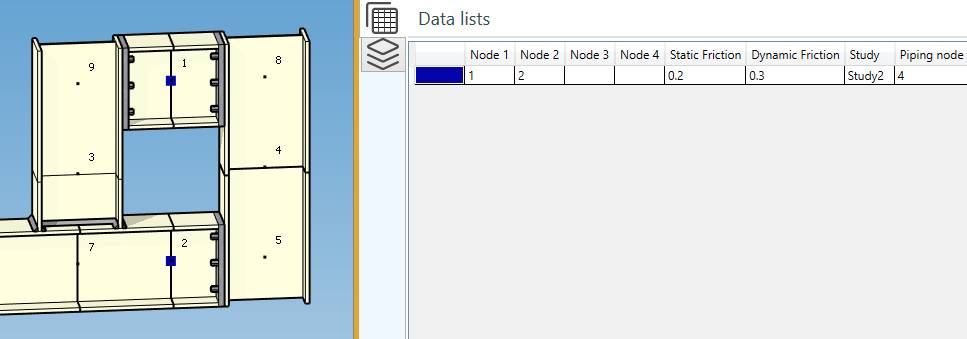
| Property | Description |
|---|---|
| Color | - |
| Node 1 | First structure node of the link |
| Node 2 | Second structure node of the link |
| Node 3 | Third structure node of the link |
| Node 4 | Fourth structure node of the link |
| Static friction | Static friction factor |
| Dynamic friction | Dynamic friction factor |
| Study | Name of the linked piping study |
| Piping node | Name of the linked piping node |
The data are not editable
Click here for more information about links.
12. View options

 show/hide the node name
3 modes :
- Hide all nodes
- Show all nodes
- Show only restrained nodes
 show/hide the node point
 shows/hides the labels
 shows/hides the origin symbol
 shows/hides the masses
 modify the font
 show the structure in shaded mode
 show the structure in hidden lines mode
 show the structure in wireframe mode
 shows/hides the restraints
 increase the restraint’s size
 decrease the restraint’s size
 shows/hides the linked study models
 copy the 3D view to the clipboard
 shows/hides the concrete