Sample 13 : Get max stress ratio in Analysis tab
1. Goal
Create a script that will (after pressing a button in the python tab) show the max stress ratio of the whole solution. This tool will only be accessible in Analysis tab.
2. Script definition
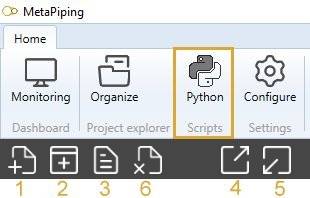
From the Home/Python, click on button 2 (Add script) :
Select “Design script” and give it the name “MaxStressRatio_Analysis”
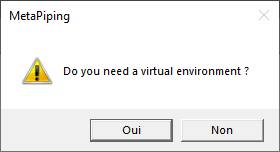
Say NO to the question about creation of virtual environment. The Requirements.txt will be hidden.
3. Script files
This kind of script needs an image in order to illustrate the button.
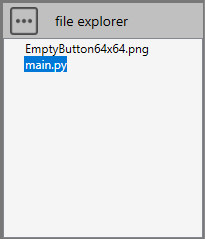
Press the “three points” button and select “Import image”. You need to create a 64x64 png image for the icon of the button.
4. Script properties
In this kind of script, user has to define the button :
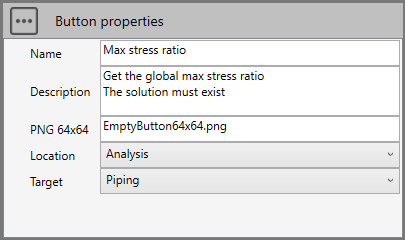
The location will be Analysis so that the button appears on the right tab with its icon and description. The target is piping system.
5. main.py
Select the file.
Copy/paste this code in the Editor :
############################################
# Get the max stress ratio in Analysis tab #
#                @CWANTIC                  #
############################################
solution = design.getSolution()
if solution != None:
    window = design.createVariableWindow()
    window.SetTitle("Max stress ratio")
    window.AddComment("Max stress ratio = {}".format(round(solution.getMaxStressRatio(),3)))
    window.ShowModal()
    solution.Dispose()
else:
    window = design.createVariableWindow()
    window.SetTitle("Max stress ratio")
    window.AddComment("No solution !")
    window.ShowModal()
Save it !
6. Result
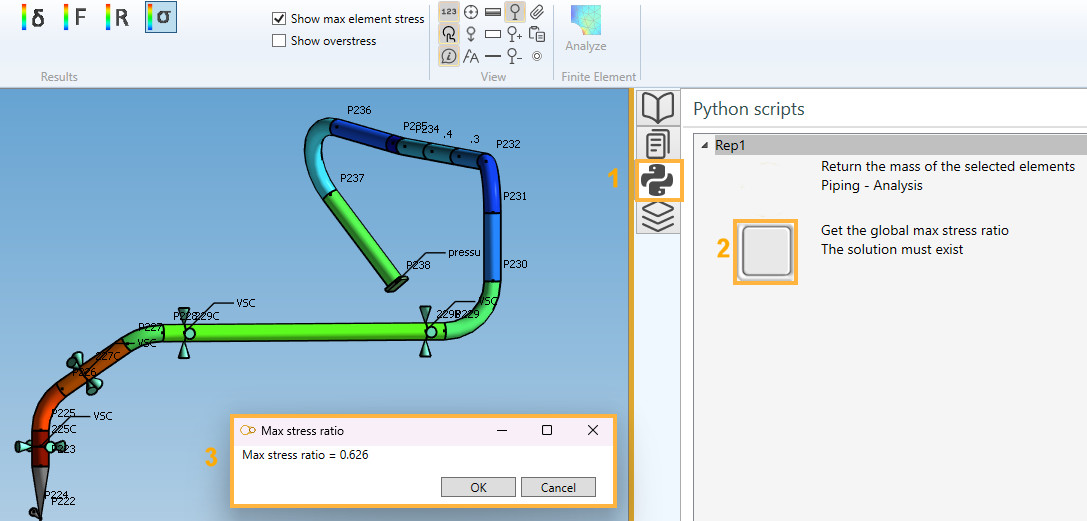
In Analysis, open the Python tab (1), click on the new script image (2). The window shows the result (3):
7. Conclusion
This example illustrates how to access the solution and show on a custom window all results or post-processing calculations.
Click here to have more informations about the solution object.
Click here to have more informations about the Variable Window object.